Cloudflare performance: Why 60% of networks now lead
Cloudflare now leads 60% of the top 1,000 global networks in speed, a massive jump from just 40% last year. (Cloudflare's network performance update developer week 2025) This isn't magic; it's math. By anchoring performance definitions in Real User Measurement and the trimean metric, we stop chasing theoretical throughput and start fixing actual user pain. The data shows Cloudflare outperforming Akamai and Fastly in global benchmarks, driven by an HTTP/3 architecture that shaves milliseconds where it counts.
Optimization has shifted from reactive firefighting to proactive infrastructure planning, with over 55% of businesses now prioritizing reliable connections over fixing breaks after they occur. The trajectory is stark: Cloudflare's ranking climbed from 33% in June 2021 to 487 out of 1,000 networks by early 2025, before hitting the current 60% mark in December 2025. Shaving milliseconds demands rigorous connection time analysis, not guesswork.
Background tests triggered during user errors allow providers to smooth out noise using trimean calculations, capturing genuine experiences across diverse geographies. Expanding points of presence in locations like Constantine and Wroclaw correlates directly with these ranking improvements. But hardware alone doesn't win races. Strategic congestion control mechanisms and software efficiency allow one provider to pull ahead of competitors like Amazon CloudFront and Google in the real world.
The Role of Real User Measurement and Trimean in Defining Network Speed
Defining Connection Time as the Primary RUM Metric
Stop looking at download speed. Connection time measures the duration for an end user device to complete a handshake with a target endpoint. This metric serves as the core unit for Real User Measurements because it captures actual interaction latency rather than theoretical throughput limits. Data collection targets the 1,000 largest networks globally by estimated population, using APNIC records to ensure geographic representation. Unlike active probes that require user initiation, this approach gathers data silently during error page events, removing the bias inherent in voluntary speed tests.
We prioritize TCP Connection Time over raw download speeds to reflect perceived Internet performance under real-world congestion. Active testing tools often report maximum capacity, yet such figures rarely match the experience of loading a standard webpage during peak hours. Passive logging eliminates the need for dedicated probing budgets while generating continuous performance signals from diverse client environments.
| Metric Type | Trigger Mechanism | Data Bias |
|---|---|---|
| Active Test | User Initiated | High (voluntary) |
| Passive RUM | Error Page Load | Low (silent) |
Focusing on handshake duration reveals bottlenecks in TLS termination and routing efficiency that bulk transfer rates obscure. A network might sustain high throughput yet suffer from slow connection establishment, degrading the experience for short-lived HTTP transactions common in modern applications. Operators optimizing solely for bandwidth miss these latency spikes that directly impact user retention. The 90th percentile of these measurements provides a realistic baseline for service level agreements, discounting transient outliers that skew average values. This statistical filtering ensures reported speeds align with typical user expectations rather than idealized laboratory conditions.
Deploying Hybrid Passive Models Across Global Geographies
Global coverage demands more than just hardware; it requires passive logs combined with active Real User Measurements to capture background performance data. This hybrid model eliminates the credit system constraints found in hardware probe networks like RIPE Atlas. (Ripe atlas) Operators gathering passive logs avoid the sampling bias inherent in voluntary, user-initiated tests. The architecture records transmission rates continuously while triggering silent speed checks only during error states. Such a design captures steady-state throughput that active probes frequently miss during idle periods.
Infrastructure expenses drop significantly when collecting Real User Measurements silently during error pages instead of funding dedicated active probing budgets. The shift from hardware dependence to software-based observation allows scaling across nearly every geography without physical deployment limits. However, this method relies on error frequency; low-error networks yield fewer data points than unstable connections.
| Model Type | Data Trigger | Geographic Scope | Cost Driver |
|---|---|---|---|
| Active Probe | Scheduled Test | Limited by Hardware | Capital Expenditure |
| Hybrid Passive | Error Page + Logs | Global via Users | Software Overhead |
You lose visibility into peak theoretical speeds since the system discounts outliers by design. Network engineers gain a cleaner signal for typical user experience rather than maximum link capacity. This approach ensures rankings reflect actual daily conditions instead of optimized test environments. Connection time captures actual handshake latency during error events, avoiding the sampling bias of voluntary active tests.
Ookla relies on user-initiated sessions that rarely reflect background network congestion or typical application behavior. In contrast, Cloudflare triggers silent checks only when users encounter failure pages, generating data without requiring participant action. RIPE Atlas employs hardware anchors that deliver physical layer verification but operate under a restrictive credit system limiting scan frequency. This financial constraint prevents continuous monitoring across diverse last-mile geographies compared to passive log aggregation.
| Method | Trigger Mechanism | Cost Model | Coverage Granularity |
|---|---|---|---|
| Cloudflare RUM | Silent Error Page | Free / Passive | Top 1,000 Networks |
| Ookla | User Initiated | Free / Ad-Supported | Voluntary Samples |
| RIPE Atlas | Scheduled Probe | Credit Based | Manual Selection |
Active testing creates a fundamental blind spot regarding steady-state performance under load. Users rarely run speed tests when experiencing slow background updates, skewing results toward optimal conditions rather than real-world constraints. Passive collection captures these degraded states automatically, offering superior precision for capacity planning. However, hardware probes provide unique traceroute visibility that software-only methods cannot replicate without deeper packet inspection. Operators must balance the scale of passive datasets against the specific diagnostic depth offered by dedicated hardware-based probes. Legacy C-based proxies often stall during SSL/TLS termination due to manual pointer management risks, forcing conservative garbage collection pauses that inflate processing time. Rust enforces memory safety at compile time, removing these runtime checks and allowing the core proxy to sustain higher throughput with deterministic CPU usage. This architectural shift transformed software efficiency from a bottleneck into a performance multiplier, complementing physical expansions in Wroclaw and Malang.
| Architecture | Memory Safety Model | Runtime Overhead | Primary Failure Mode |
|---|---|---|---|
| Legacy C/C++ | Manual pointers | High (GC pauses) | Buffer overflow |
| FL2 (Rust) | Borrow checker | Near-zero | Compile-time error |
Adding points of presence yields diminishing returns without parallel code-level efficiency. The FL2 migration proves that low-level language optimization drives measurable gains where hardware proximity alone cannot. Ignoring software architecture leaves significant latency on the table regardless of geographic footprint.
Free users in Wroclaw experienced a 40% RTT reduction, dropping from 19ms to 12ms immediately after local hardware activation. This physical proximity solves the problem of slow network performance caused by excessive hop counts to distant aggregation points. Operators must decide when to optimize software versus hardware based on whether latency stems from propagation delay or processing queues. New data centers address the former, while protocol tweaks like HTTP/3 target the latter. Relying solely on active, user-initiated tests fails to capture such background congestion patterns accurately. Hardware expansion yields massive gains in underserved regions but offers minimal impact where fiber density already ensures low propagation delay. A 5% improvement suggests the remaining latency derives from SSL/TLS termination overhead rather than wire time. Addressing this requires the Rust-based FL2 migration to reduce CPU cycles per request. Without this software layer upgrade, additional points of presence provide negligible value for enterprise workloads in well-connected areas.
Hardware Proximity Versus Architectural Efficiency in Latency Reduction
New PoPs in Constantine, Malang, and Wroclaw cut propagation delay, yet software tuning drives the remaining share of performance wins. Physical expansion solves distance-bound latency where fiber limits dominate. The Wroclaw deployment slashed round-trip times for free users, while Malang saw modest Enterprise gains due to existing backbone proximity. However, adding hardware yields diminishing returns once probe diversity saturates. Operators facing sub-5ms local RTTs cannot improve further via geography alone.
Software architecture targets processing delay within the stack itself. Migrating to the FL2 Rust-based layer reduced CPU cycles per handshake, directly expanding the network's lead across global topologies. This approach optimizes congestion window handling without new capital expenditure. Research shows measurement methodologies vary significantly on high-latency performance, meaning synthetic tests often miss these code-level efficiencies that real users feel. Prioritizing TCP Connection Time over raw throughput captures these micro-optimizations better than traditional benchmarks.
| Factor | Hardware Solution | Software Solution |
|---|---|---|
| Primary Target | Propagation Delay | Processing Delay |
| Cost Model | High CapEx | High Engineering OpEx |
| Diminishing Returns | Rapid after local PoP | Gradual with code iteration |
| Best For | Underserved Regions | Mature Markets |
Budget allocation dictates strategy: physical nodes fix coverage gaps, but architectural efficiency secures market leadership where infrastructure already exists.
Cloudflare Outperforms Akamai and Fastly in Global Speed Benchmarks
Defining the 6ms Average Latency Advantage Over Competitors
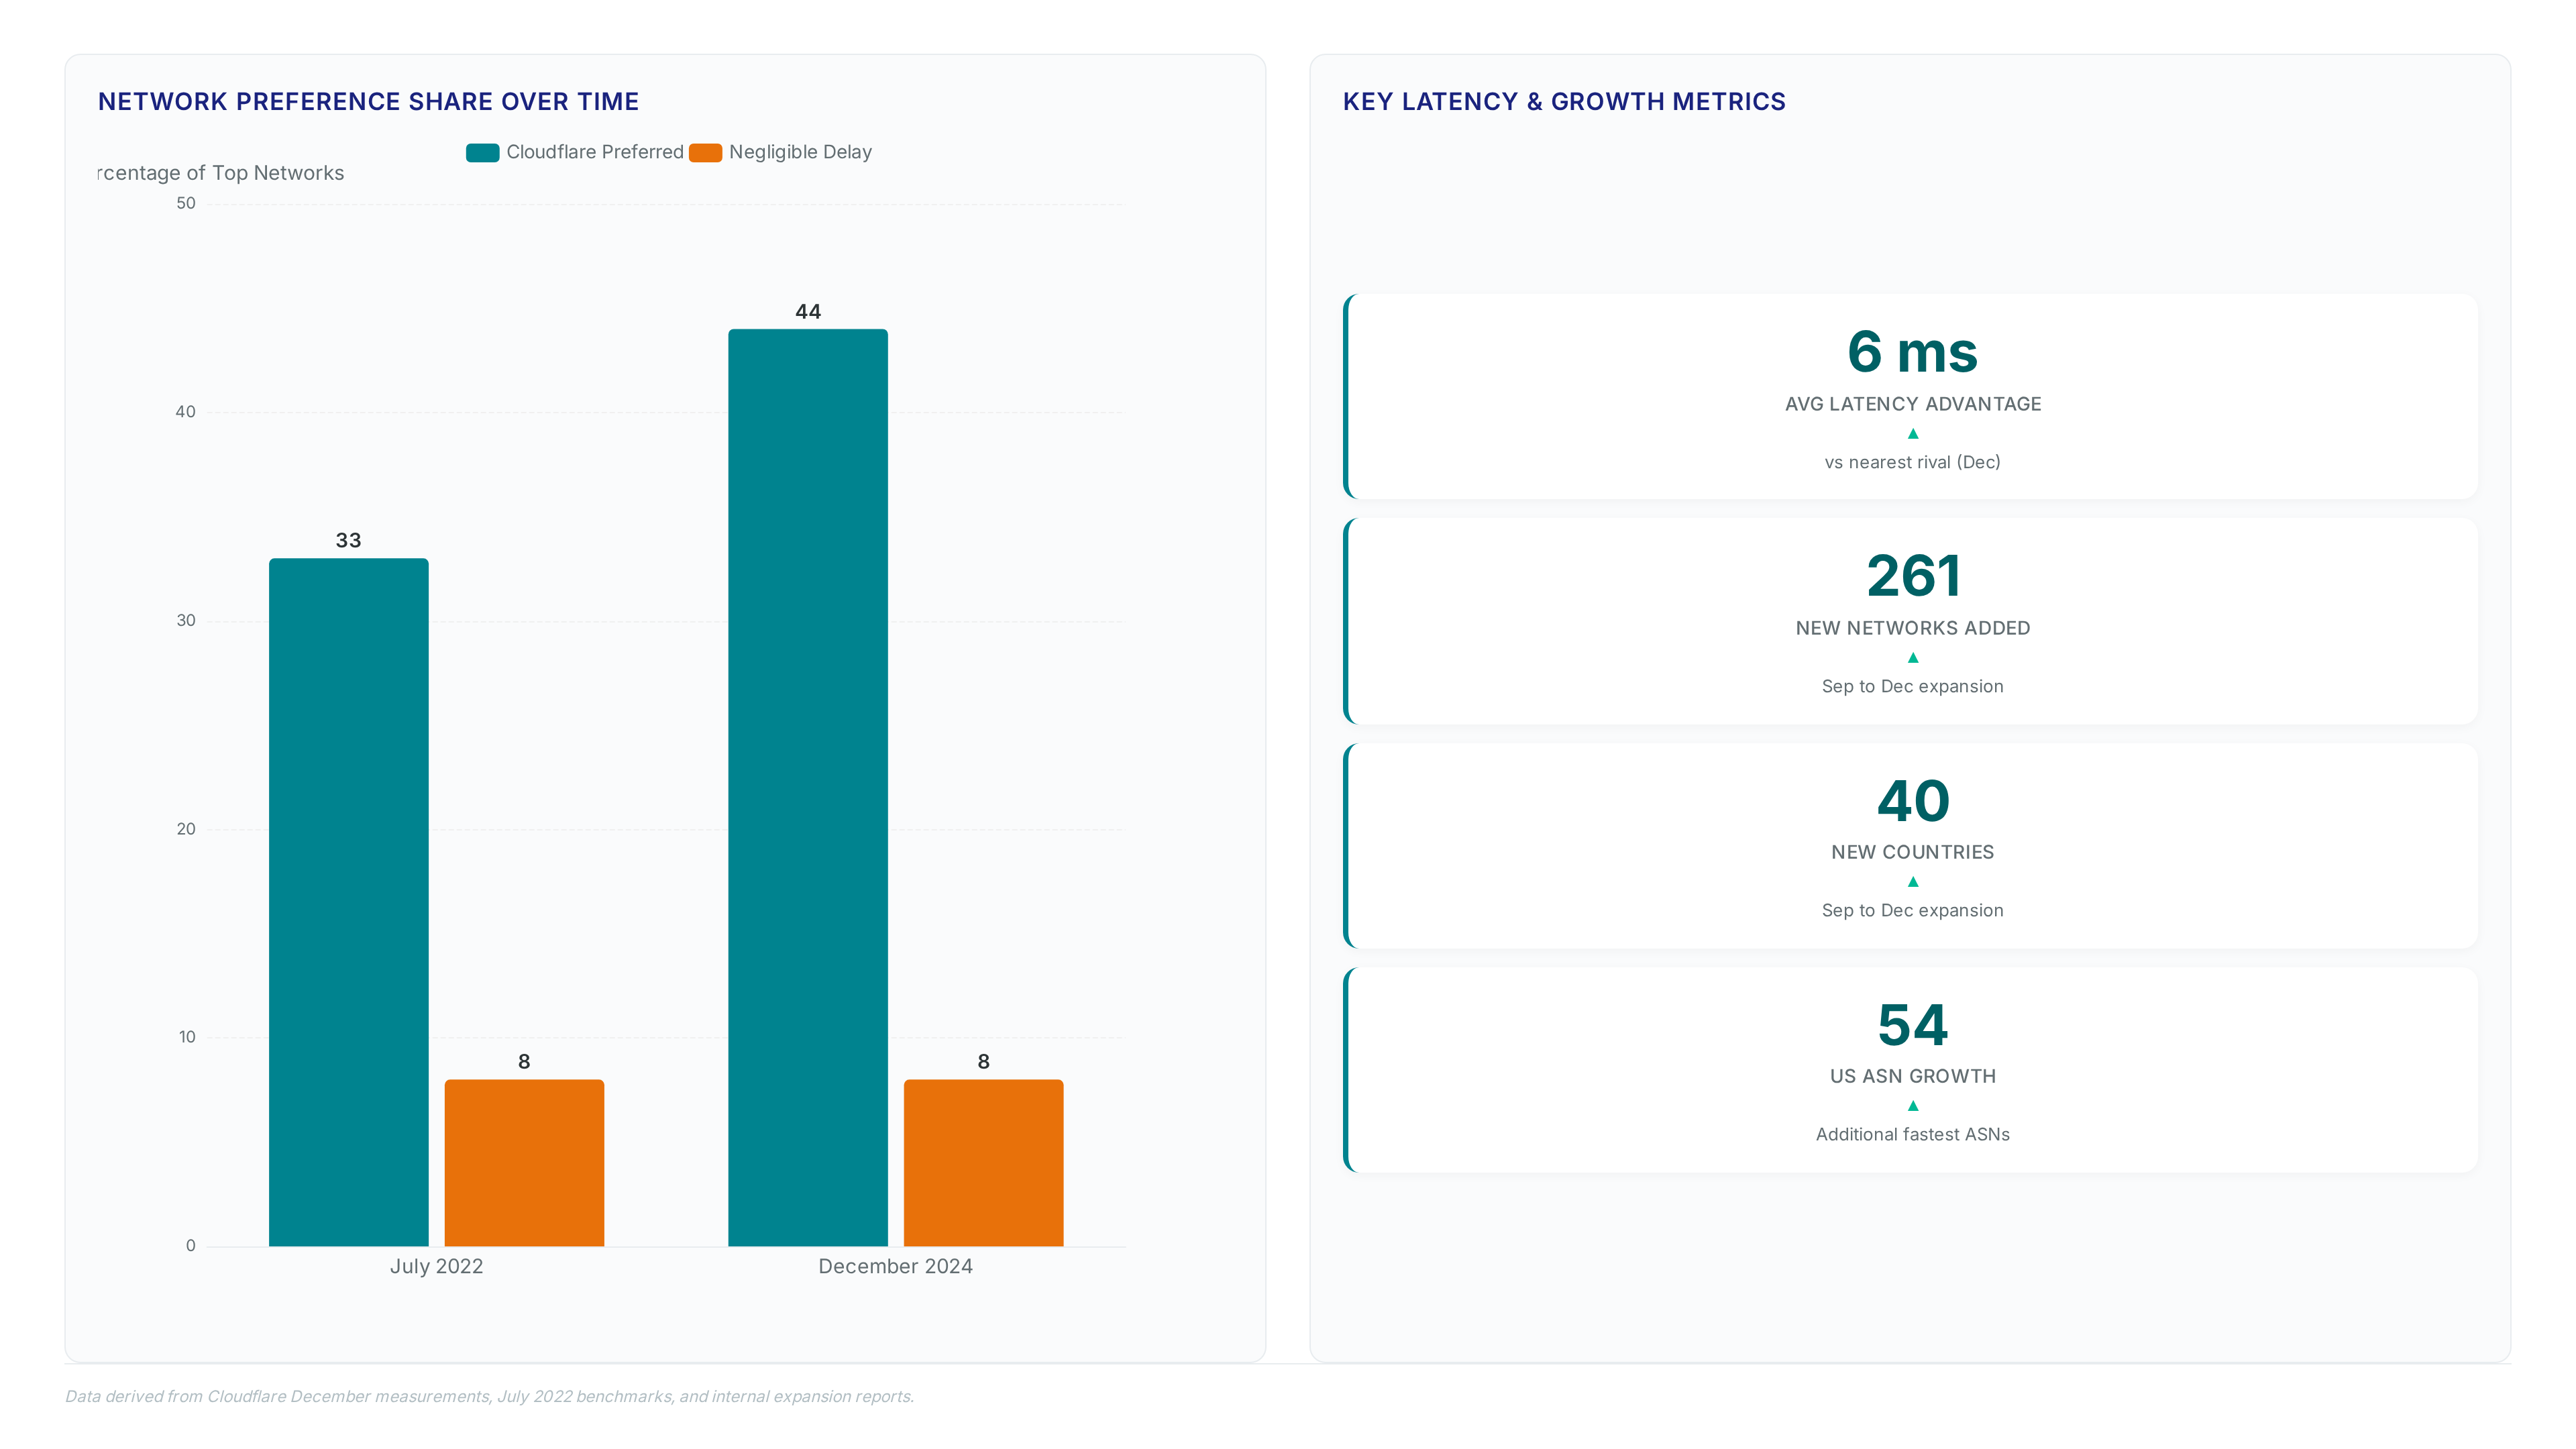
December measurements recorded a 6ms average latency advantage for Cloudflare over the nearest rival across top global networks. This metric derives from connection time data collected when browsers fetch small files during error page loads, creating a passive baseline against Akamai and The analysis prioritizes the trimean of TCP handshakes rather than peak throughput, smoothing outliers to reflect typical user experience.
| Dimension | Cloudflare Approach | Competitor Baseline | Outcome |
|---|---|---|---|
| Data Trigger | Passive error-page fetches | Active user-initiated tests | Higher sample diversity |
| Metric Focus | TCP Connection Time | Download speed + jitter | Closer to perceived speed |
| Consistency | Monthly average lead | Sporadic peak wins | Stable 6ms gap |
Earlier benchmarks from July 2022 showed tighter margins, with only 33% of networks favoring Cloudflare and an additional 8% within a negligible delay. The shift to a consistent 6ms lead indicates that architectural optimizations now outweigh raw geographic proximity in many regions. However, this average masks variance; specific ASNs in Europe still show negligible differences where physical distance dominates routing logic. Operators interpreting these results must distinguish between software-induced processing delays and fiber-propagation limits. A 6ms win in software stack efficiency does not guarantee superiority in trans-oceanic links where light speed governs performance.
Expansion between September and December added 40 countries and 261 networks where Cloudflare now holds the speed lead. The United States drove this growth, with 54 more ASNs ranking the provider as fastest for end users. This geographic spread converts raw latency advantages into tangible application responsiveness for diverse regional populations. Operators evaluating Cloudflare vs Amazon CloudFront must consider that server placement strategy determines whether speed gains stem from physical proximity or software efficiency. Cloudflare's approach measures end-to-end performance to the edge, isolating the full path rather than specific segments.
| Region Type | Growth Driver | Primary Benefit | Limitation |
|---|---|---|---|
| United States | 54 new ASNs | Reduced hop count | Congestion varies by ISP |
| Emerging Markets | 40 new countries | First-time low latency | Backhaul capacity constraints |
| Global Aggregate | 261 networks | Consistent handshake times | Peering disputes persist |
The methodology relies on Real User Measurements triggered silently during error pages to capture actual background performance without user intervention. This passive collection avoids the selection bias inherent in active, user-initiated tests common to other benchmarking tools. While the 6ms average advantage persists, mobile traffic now exceeds half of global requests, forcing measurement priorities to shift toward wireless network conditions. Choosing Cloudflare for performance yields immediate gains in newly covered regions, yet operators in areas with poor backhaul may see diminishing returns regardless of edge presence. This market share growth reflects a deliberate shift from hardware expansion to software optimization within the request handling layer.
In practice, the FL2 migration to a Rust-based architecture directly enabled this performance jump by reducing CPU cycles per connection. However, maintaining this lead requires continuous tuning as mobile traffic now exceeds half of global request volume. Operators comparing Cloudflare vs Fastly speed must recognize that synthetic benchmarks often ignore the connection time variance introduced by device heterogeneity. The program initiated in 2021 established a baseline that makes current gains quantifiable rather than anecdotal.
Defining the Hybrid Passive Data Collection Model for Latency Diagnosis
Hybrid passive data collection captures real-user handshakes silently during error states to bypass the sampling bias inherent in active tests. This methodology records connection time directly from browser sessions, avoiding the artificial congestion patterns often introduced by active user-initiated tests that skew performance baselines. Unlike hardware probe networks requiring credit systems, this model uses existing traffic flows to generate high-fidelity datasets without operator intervention. The architecture merges steady-state transmission logs with triggered measurements, ensuring visibility into both nominal operations and failure modes as detailed in passive log analysis.
| Data Source | Trigger Mechanism | Bias Profile |
|---|---|---|
| Active Probes | Scheduled intervals | Overestimates throughput |
| Hybrid RUM | Error page loads | Reflects actual congestion |
| Synthetic Tests | Manual initiation | Ignores background noise |
Relying solely on synthetic benchmarks masks last-mile degradation that only appears under genuine load conditions. The limitation involves reduced sample frequency during stable periods, requiring statistical smoothing via trimean analysis to maintain signal clarity. Operators diagnosing latency must prioritize datasets capturing actual user experience over theoretical maximums to identify true bottlenecks. This transition requires deploying AI and automation tools that analyze traffic patterns to forecast outages before they impact user experience. Operators must move beyond historical reporting to implement systems that optimize routing dynamically, reducing round-trip time through anticipatory adjustments rather than post-incident fixes.
The industry standard for such diagnostics often involves platforms like Measurement Lab, which provide free advanced testing to establish baseline performance metrics without financial barriers. However, relying solely on external diagnostics fails to capture the detailed congestion windows within a specific autonomous system. Internal telemetry must correlate with these external benchmarks to validate whether predicted path changes actually lower latency for real users.
| Strategy | Reactive Approach | Proactive Planning |
|---|---|---|
| Trigger | Post-outage alert | Predictive anomaly detection |
| Data Source | Historical logs | Real-time AI analysis |
| Outcome | Service restoration | Latency reduction |
Adopting this model introduces a trade-off: the complexity of integrating predictive algorithms increases operational overhead initially. Yet, the cost of ignoring routing optimization manifests as repeated latency spikes during peak traffic windows. The limitation remains that accurate prediction depends on high-fidelity data ingestion, which many legacy stacks cannot support without architectural upgrades.
Managing Latency Spikes from Post-Quantum Encryption Key Exchanges
Larger post-quantum key exchanges inflate connection time metrics, directly challenging operators attempting to fix high connection latency during security upgrades.
About
Nikita Sinitsyn serves as a Customer Service Specialist at InterLIR, bringing eight years of dedicated experience in the telecommunications sector to the critical discussion of network performance. His daily work managing RIPE and ARIN database operations, alongside overseeing BGP route objects and IP reputation, provides him with unique, ground-level insights into how infrastructure quality directly impacts global connectivity. While the article highlights Cloudflare's pursuit of speed, Sinitsyn's expertise at InterLIR focuses on the fundamental layer of network availability: the secure redistribution of IPv4 resources. By ensuring clean IP transfers and resolving address scarcity, he enables the very networks that strive for millisecond improvements. This practical background in maintaining secure, efficient IP markets makes him uniquely qualified to analyze the complexities of modern network architecture and the relentless drive for quicker, more reliable internet experiences.
Conclusion
Predictive routing fails when legacy hardware cannot ingest the high-fidelity telemetry required for accurate anomaly detection. The operational cost shifts from simple bandwidth procurement to continuous algorithmic tuning, specifically as post-quantum key exchanges inflate packet sizes and distort standard latency averages. Relying on historical logs for capacity planning is now a liability, as it masks the specific handshake degradation caused by heavier cryptographic material. Teams must transition to real-time statistical filtering immediately to distinguish between genuine network congestion and security-induced delay.
Organizations should mandate a shift to proactive performance engineering by Q2 2026, but only after validating that their current stack supports trimean-based metric aggregation without introducing processing lag. Do not attempt global deployment until local nodes prove they can isolate bulkier initial packets from baseline throughput data. Start by auditing your TCP congestion window configurations this week to ensure they accommodate larger post-quantum handshakes before adjusting any routing policies. This specific tuning prevents false positives in outage detection systems while maintaining sub-10ms response times for real-time traffic.
Frequently Asked Questions
Cloudflare gathers data silently during error pages to eliminate probing costs. This passive method now covers 60% of global networks, proving efficient scaling without dedicated hardware expenses for every single data point collected worldwide.
Users in Wroclaw experienced a 40% reduction in round-trip time immediately after activation. This drop from 19ms to 12ms demonstrates how adding local points of presence directly accelerates connection speeds for free users in that region.
Malang already ensured low propagation delay, leaving little room for major gains. The recorded 5% improvement suggests the remaining latency stems from factors other than physical distance or basic network infrastructure limitations.
Cloudflare climbed from holding the top spot in 33% of networks to leading 60% today. This significant jump highlights the effectiveness of their proactive performance engineering strategies over the last few years.
Enterprises can deploy zero-licensing-cost solutions like OpenSpeedTest via Docker images. This approach avoids recurring fees while allowing organizations to run their own internal benchmarks without relying on external commercial speed test providers.