DNS logs reveal hidden CDN costs for operators
With 60% to 70% of DNS in Bangladesh resolved by third parties like Google, operators blindly surrender content location selection.
DNS logs are the only reliable mechanism for reclaiming visibility into CDN efficiency and controlling delivery costs. As the global CDN industry pivots from simple caching to distributed edge computing between 2025 and 2026, relying on external resolvers means asset owners cannot verify if traffic hits on-net caches or expensive global nodes. This opacity directly impacts service quality and bottom-line expenses, demanding a shift toward self-hosted instrumentation.
Extract CDN source-per-query data using PowerDNS Recursor to capture specific parent domain interactions without disrupting production. Pipe JSON feeds into ClickHouse tables for raw queries and IP mappings, then visualize through Grafana. This open-source approach outperforms traditional monitoring suites, allowing operators to classify Facebook and Google placements to validate network performance independently.
The Strategic Role of DNS Logs and Source of Truth in Network Visibility
Defining Source of Truth with NetBox and Zabbix
Stop tracking network state in spreadsheets. A Source of Truth functions as the single authoritative repository for network state, replacing manual tracking with automated data management. NetBox and Zabbix track deployment status, moving systems from planned to active without human intervention. This architecture validates ADN Telecom's search for opportunities to analyze data within the DNS system. The system designed by the team uses NetBox, Zabbix, Python, Jinja, and Paramiko to provision data and connect radio networks. Operators shifting from spreadsheet-based inventories gain immediate visibility into configuration drift.
| Feature | Manual Tracking | Automated SoT |
|---|---|---|
| Update Latency | Days | Seconds |
| Error Rate | High | Negligible |
| Audit Trail | None | Complete |
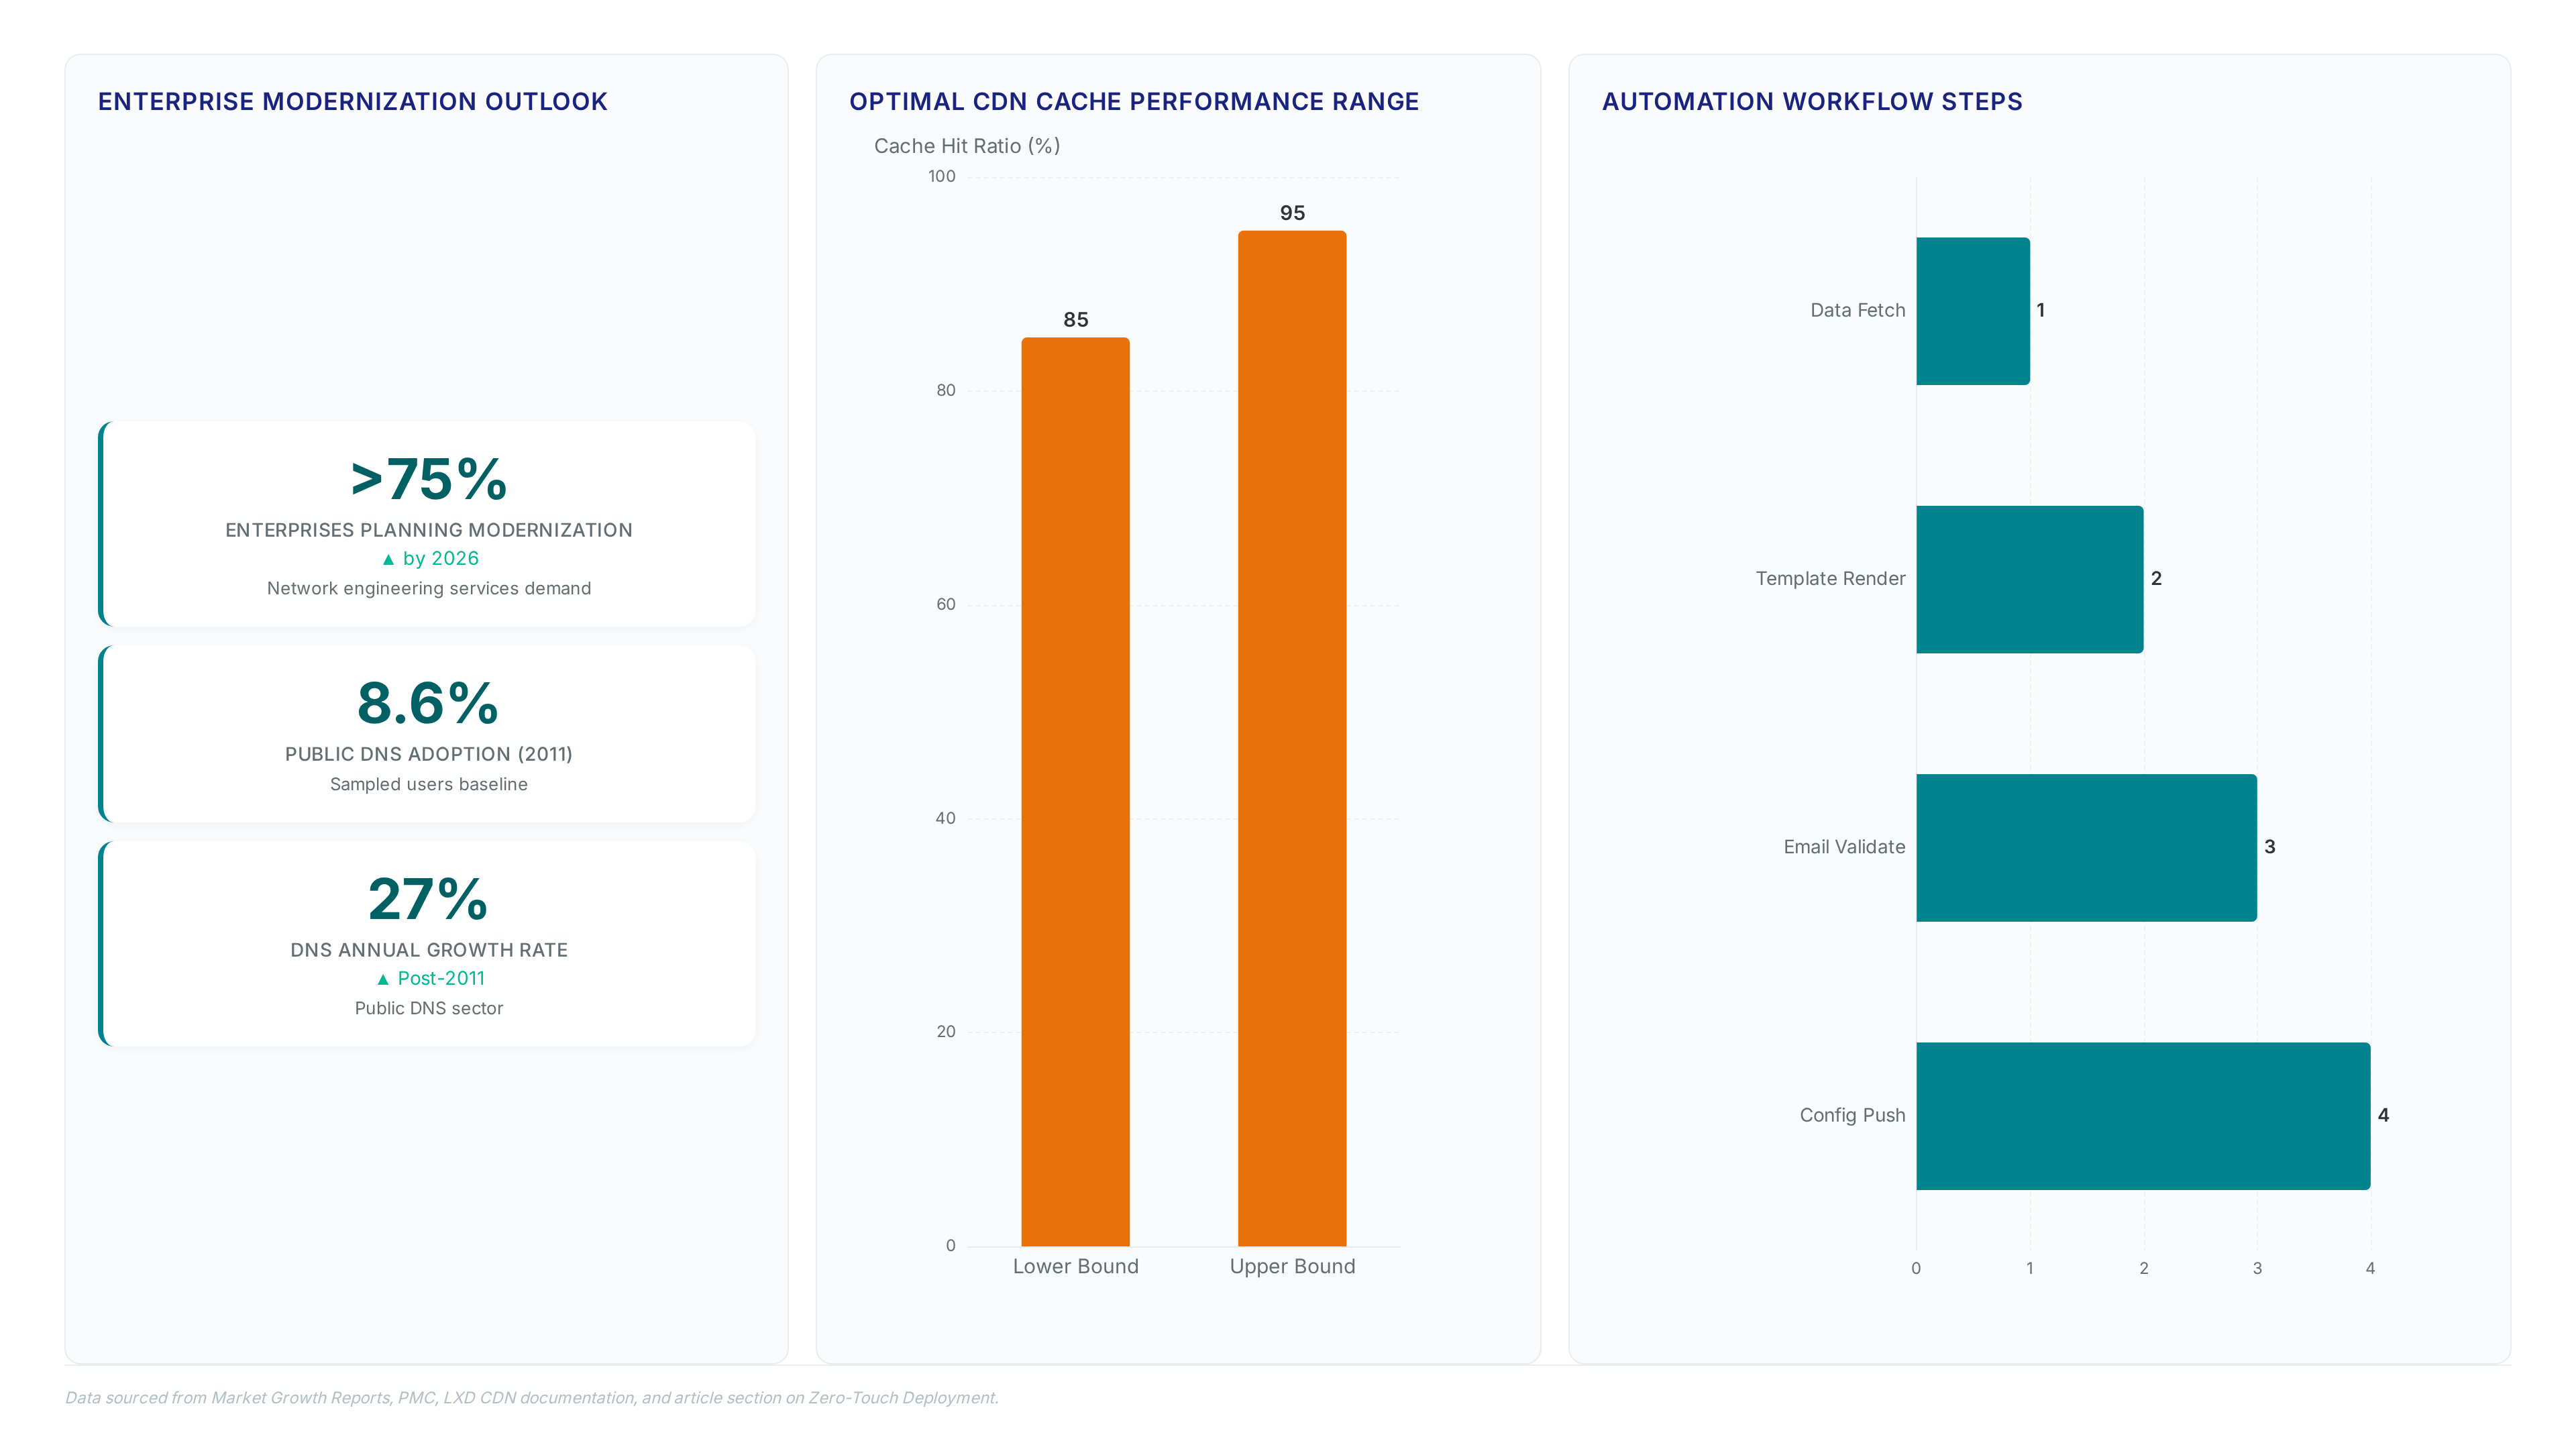
Legacy devices often lack API support for direct synchronization. Integration requires custom scripting to parse proprietary output formats into standardized JSON feeds. Despite this hurdle, the 2026 Enterprise Modernization Plan targets >75% adoption of such automated systems. Reliance on disjointed data sources creates blind spots during outage responses. A unified view prevents conflicting configuration pushes from competing management platforms. The cost of maintaining parallel records exceeds the engineering effort required for initial automation. Network teams must prioritize API-capable hardware to fully realize zero-touch deployment goals.
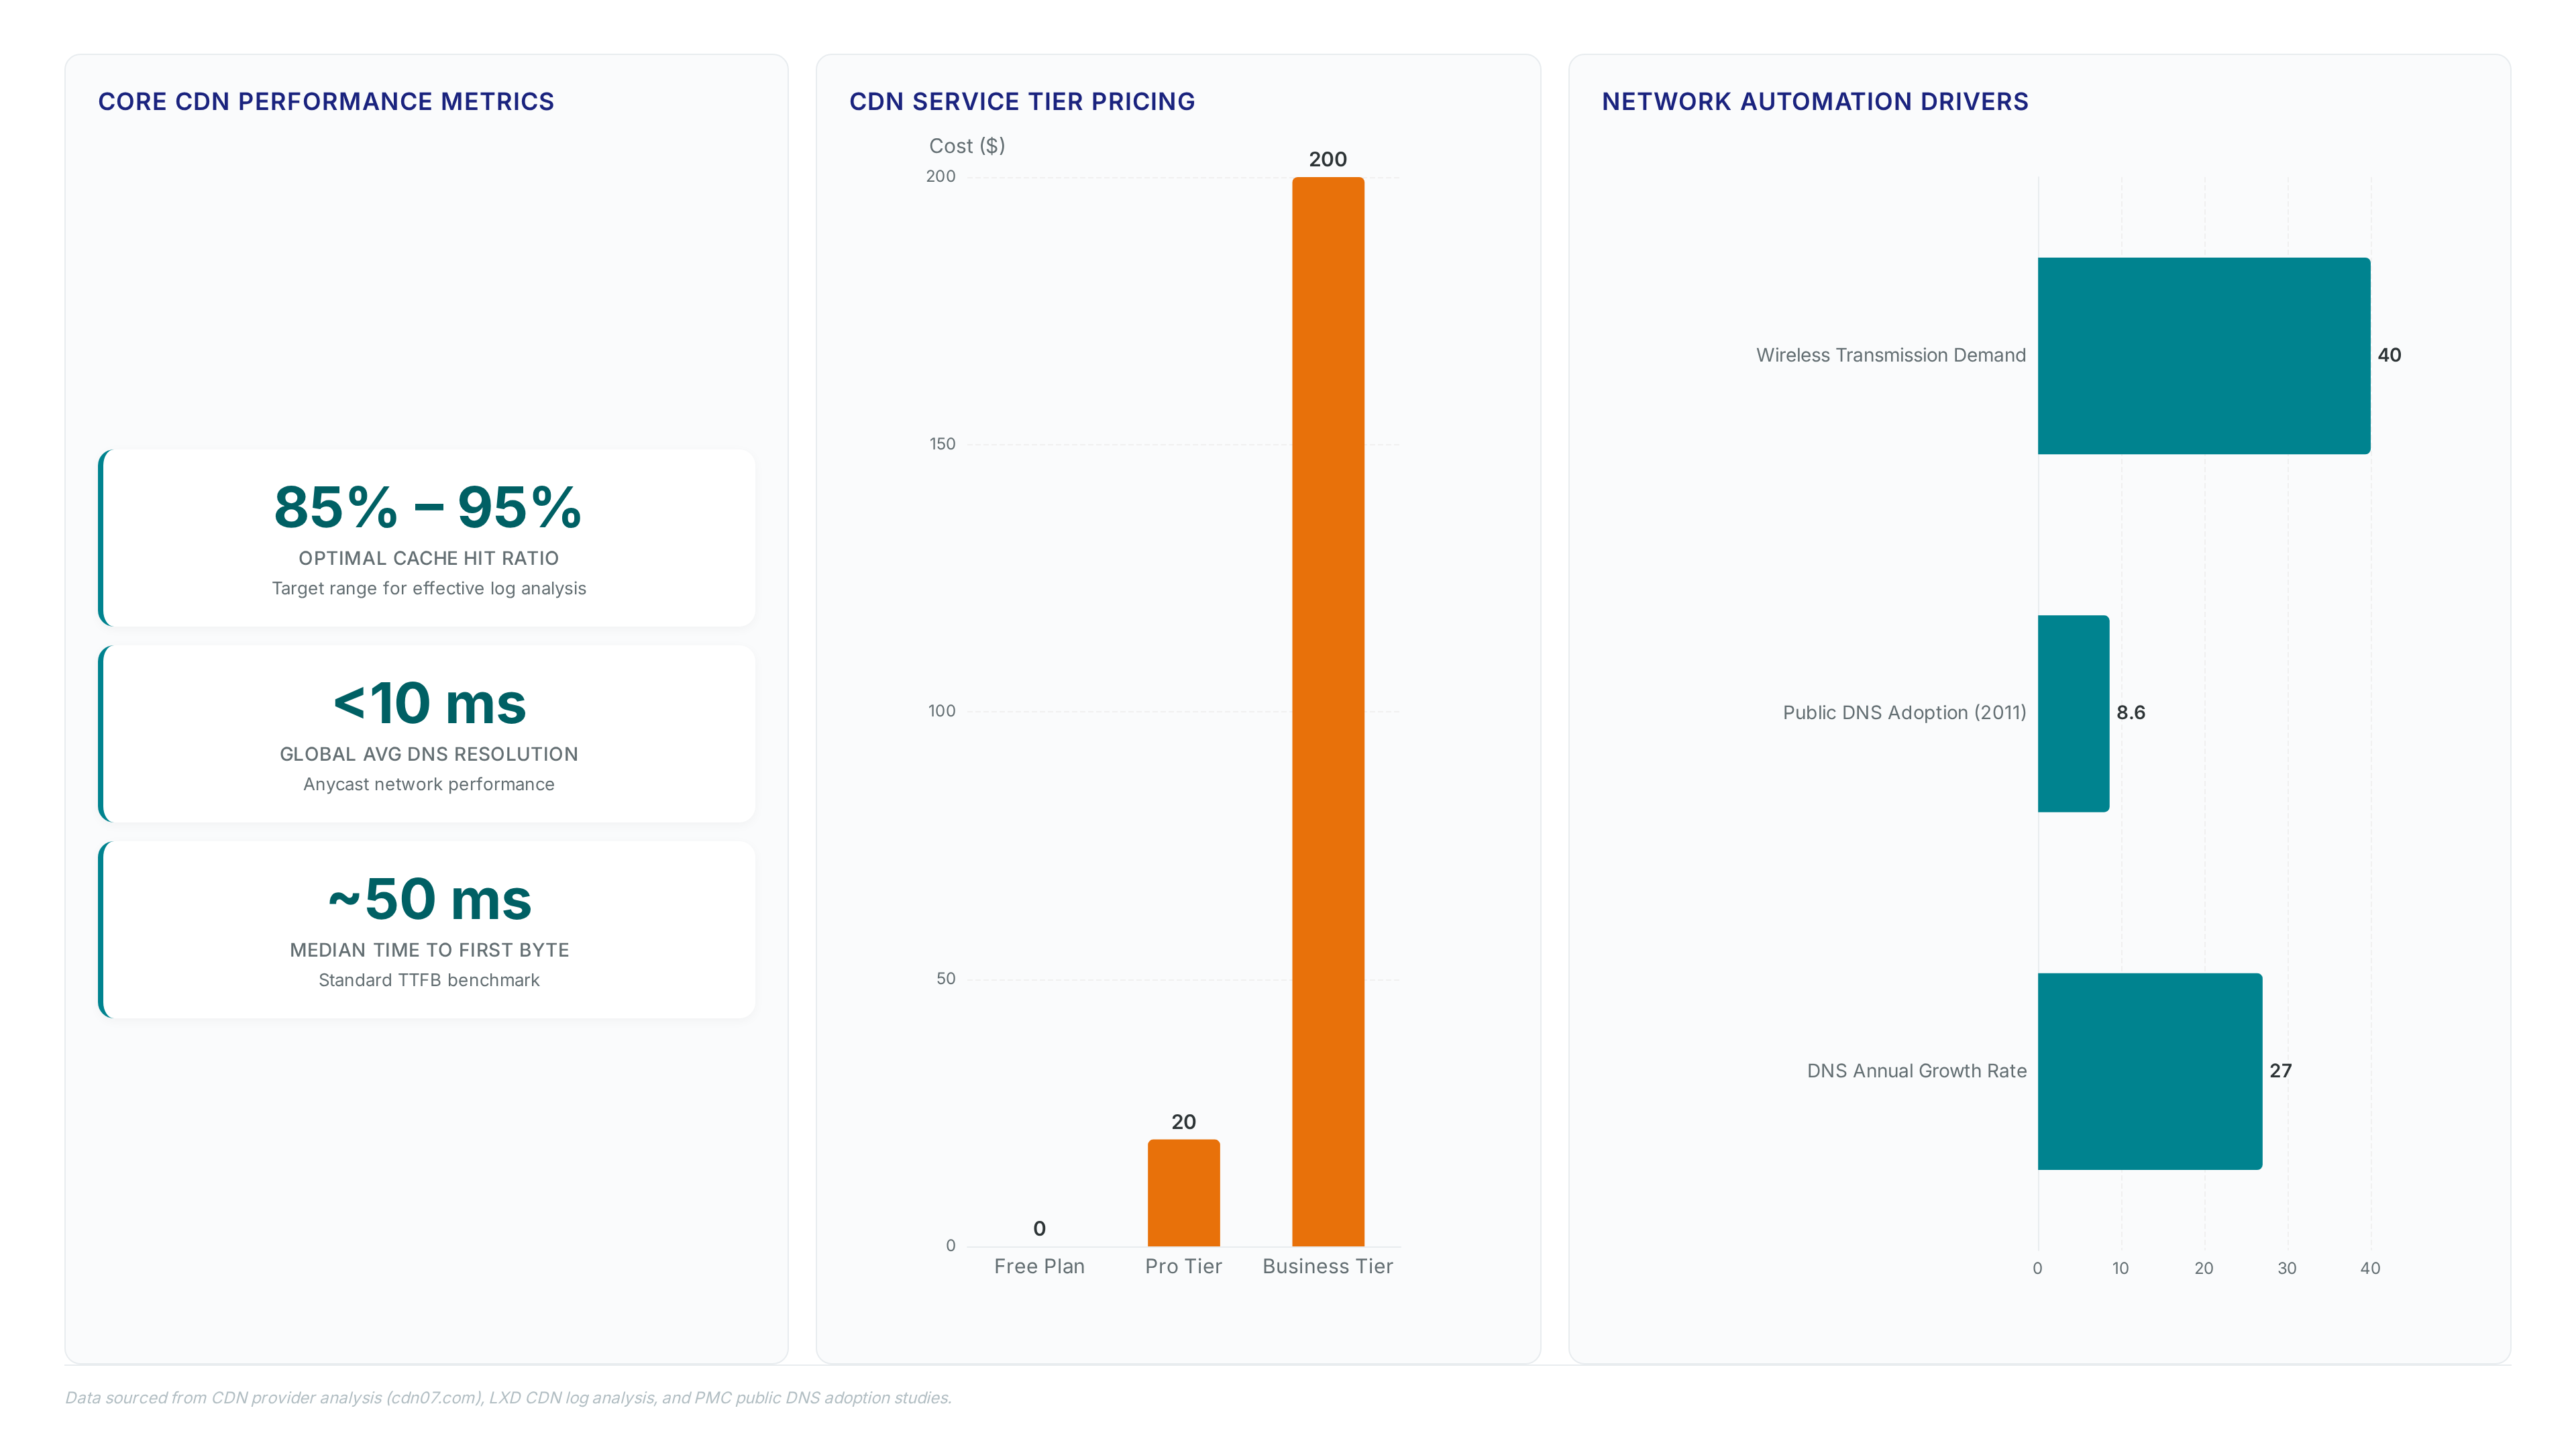
DNS log analysis extracts resolver responses to map user requests to specific CDN cache nodes. In Bangladesh Operators lack visibility into these paths without parsing query logs for IP address mappings. Extracting the resolved IP from each response allows engineers to cross-reference against known edge server ranges. This process reveals if a request hit a local peering point or traversed a transit link to a distant region. High CDN efficiency depends on maximizing local hits to reduce origin bandwidth costs. A low cache hit ratio forces repeated fetches from central servers, inflating transit bills significantly. However, third-party resolver dominance means the ISP often cannot influence which node the CDN selects. Google or Cloudflare may direct traffic based on their own latency metrics rather than the operator's peering policy. (Cloudflare vs google dns) User-perceived speed clashes with operator cost control. Mitigation requires correlating DNS data with BGP routes to identify suboptimal anchoring points. Future systems might integrate NetFlow analysis Without this correlation, billing disputes with CDN providers remain unresolved due to missing evidence. Operators must build custom pipelines to aggregate these logs before they lose operational relevance. Raw logs alone offer no insight; structured parsing transforms noise into actionable routing intelligence.
Public DNS dominance forces third parties to dictate optimal content location rather than asset owners. Adoption surged from a baseline of 8.6% in 2011, marking a period of 27% annual growth that stripped operators of routing agency. This shift prevents direct control over service delivery costs because resolver choices determine which edge computing resources serve user requests. Operators ceding this function lose the ability to steer traffic toward on-net caches, forcing expensive off-net fetches. Proven log analysis strategies become the only mechanism to retroactively identify these costly paths and implement aggressive caching. Without such visibility, businesses cannot optimize bandwidth usage logs to reduce origin server consumption or validate CDN performance SLAs. The industry transformation toward distributed platforms between 2025 and 2026 exacerbates this risk as CDN providers expand their footprint beyond traditional caching. Network teams face a stark choice: invest in deep packet inspection and DNS telemetry or accept blind reliance on external resolvers. Blind trust in public infrastructure creates a structural deficit where cost optimization remains theoretical rather than operational. Operators must treat DNS data as a strategic asset to prevent margin erosion from uncontrolled traffic engineering.
Architecting Real-Time Traffic Dashboards with ClickHouse and Grafana
Grafana Dashboard Architecture for Skymedia Traffic Breakdowns
Skymedia unifies LibreNMS device health with Akvorado flow aggregations inside Grafana to enforce strict Role-Based Access Control that native tools lack. Standard flow analyzers expose all traffic to every viewer, creating competitor risks where one enterprise customer sees another's bandwidth usage. The architecture isolates data sources by querying LibreNMS via InfluxQL on a five-minute cycle while hitting ClickHouse directly for real-time NetFlow. This split prevents query storms from crashing the primary database during peak visualization demands. Direct SQL access introduces fragility; if the feed disconnects, the dashboard displays stale data without immediate alerting.
| Data Source | Query Method | Latency | Risk Profile |
|---|---|---|---|
| LibreNMS | InfluxQL | Five minutes | Low load impact |
| Akvorado | Direct SQL | Real-time | High failure exposure |
Engineers must tune SQL statements aggressively because asynchronous panel queries multiply load on the storage engine. A clone system with reduced retention mitigates high storage costs while preserving recent forensic capability. Attempts to force this logic into InfluxDB failed due to schema rigidity with flow records. Real-time log transformation requires mapping incoming fields to a strict schema and parsing timestamps on the fly to standardize field names before visualization. Without this step, inconsistent IP formatting breaks aggregation panels. The cost of direct database coupling is measurable: a single malformed query can stall the entire interface for all tenants. Operators must accept that perfect real-time visibility trades off against system stability under load. Future reimplementation will likely decouple customer load to prevent one noisy tenant from degrading performance for others. This design ensures that only authorized personnel view specific flow data, closing a gap that enterprise-level CDN services often ignore in favor of raw throughput metrics.
Implementing Five-Minute LibreNMS Feed Cycles in Real-Time Dashboards
LibreNMS operates on a fixed five-minute cycle for feeding device health, creating inherent latency against real-time visualization demands. Skymedia designed a Grafana dashboard unifying LibreNMS and Akvorado output to bridge this gap while enforcing strict access controls. Engineers must ingest periodic counter data into ClickHouse, then overlay it with real-time log transformation pipelines to normalize timestamps instantly. This hybrid approach masks the polling interval by parsing incoming fields and enriching logs with geographic data on the fly. Direct SQL queries against the flow database risk data loss if the feed disconnects during high-traffic events. A viral app scaling to 10 million users demonstrated that continuous monitoring requires adjusting caching rules quicker than standard polling allows. Operators accepting the five-minute delay gain stability but lose visibility into micro-bursts that occur between cycles.
| Feed Type | Latency | Risk Profile |
|---|---|---|
| LibreNMS | Five minutes | Low query impact |
| Akvorado | Near real-time | High data loss risk |
- Configure ClickHouse to buffer raw JSON feeds from the recursor.
- Map device counters from LibreNMS into the time-series schema.
- Apply SQL tuning to reduce asynchronous load on the database cluster.
Future implementations should architect a resilient structure that separates customer visualization load from core ingestion paths. Direct SQL queries against ClickHouse during peak concurrency cause ingestion buffer overflows, dropping IPFIX records before aggregation completes. Skymedia observed that asynchronous dashboard elements hammering the database created gaps in traffic breakdown visibility when enterprise customers refreshed views simultaneously. The Akvorado feed lacks internal queuing, meaning high read loads starve the write path required for real-time log transformation. Operators must decouple visualization from ingestion to prevent data silencing.
| Failure Mode | Trigger Condition | Consequence |
|---|---|---|
| Write Starvation | >50 concurrent SELECT queries | Incoming NetFlow packets discarded at socket |
| Buffer Overflow | Aggregation lag > 2 seconds | Gaps in traffic breakdown history |
| Timeout Cascade | Complex GROUP BY clauses | Dashboard renders stale LibreNMS counters only |
Implementing a clone system with reduced retention isolates user load from the primary writer. The cost is doubled storage overhead, yet the limitation of a single shared database proves fatal during monitoring spikes. Aggressive caching of high-demand dashboard queries reduces origin bandwidth consumption and stabilizes the ingestion pipeline.
Comparative Analysis of open-source Monitoring and Configuration Tools
Defining Zero-Touch Deployment with NetBox and Paramiko
Zero-touch deployment activates when NetBox stores the exact serial number mapping required for granular identity based device provisioning without manual console access. This architecture replaces physical site visits with a logic chain where Python scripts fetch device state, Jinja renders configuration templates, and Paramiko executes Secure Shell sessions to push changes. Ulsbold Enkhtaivan demonstrated this workflow at Mobicom to manage mobile backhaul updates driven by fluctuating network loads. The system relies on email-based confirmations to validate changes before the fetch-change-test-rewrite cycle commits data to the live plane. Operators should implement this model when wireless transmission modes contribute significantly to engineering costs and field teams cannot scale manually.
| Component | Function | Limitation |
|---|---|---|
| NetBox | Source of Truth for device identity | Requires perfect serial number hygiene |
| Paramiko | Secure remote execution engine | Fails silently if SSH keys rotate |
| Jinja | Template rendering for configs | Logic errors propagate to all devices |
Automation speed conflicts with safety; the current Mobicom implementation mediates relationships manually to prevent routing plane failures. While the approach reduces wage costs associated with on-site demands, scaling issues emerge when device-to-device relationships lack automated discovery. Future integrations may extend this logic to analyze DNS log data. The drawback is that any drift between the source of truth and physical reality causes immediate provisioning rejection.
Zabbix triggers status transitions from planned to active by polling NetBox API endpoints for device serial number changes. Operators script Python glue logic to parse JSON templates, converting raw inventory data into Jinja-rendered configurations ready for deployment. The workflow isolates the source of truth from the execution plane, preventing configuration drift during high-volume radio network updates. Paramiko This architecture supports email-based confirmation steps before the fetch-change-test-rewrite cycle commits changes to the routing plane. Wireless transmission modes now drive roughly 40% of engineering market demand, requiring such flexible mobile management solutions to scale effectively. A key tension exists between automation speed and safety; the system currently relies on manual mediation to avoid critical plane failures. Direct integration without human validation risks propagating erroneous templates across the backhaul network instantly.
| Integration Point | Data Direction | Latency Impact |
|---|---|---|
| NetBox to Zabbix | Inventory State | Near real-time |
| Zabbix to Python | Trigger Event | Sub-second |
| Python to Device | Config Push | Variable |
Future expansions may link this telemetry with.
RFC 789 from 1981 documented how manual text-file edits caused ARPANET router failures, a risk modern NetBox automation eliminates through structured data. Early network management required engineers to type commands directly into serial consoles, storing configurations in non-volatile memory without validation logic or version control. This manual approach, specified alongside SGMP in RFC 1028, left networks vulnerable to human error during every update cycle. Modern tools replace this fragility with JSON-driven templating that renders consistent device states before any packet hits the wire. Operators now use Python scripts to fetch inventory data, apply Jinja logic, and push verified configs via Paramiko SSH sessions. The shift moves control from reactive typing to proactive validation, ensuring serial-number-to-configuration mappings remain intact across thousands of nodes.
| Feature | RFC 789 Manual Era | NetBox Automation |
|---|---|---|
| Input Method | Text file editing | JSON data modeling |
| Validation | Post-deployment ping tests | Pre-render template checks |
| Rollback Speed | Hours via console cable | Seconds via API revert |
| Error Source | Typos in CLI commands | Logic bugs in templates |
Adopting this model demands strict discipline in data entry, as a single wrong serial number in the source of truth propagates errors instantly. The cost of migration includes retraining staff who rely on muscle memory for CLI inputs rather than data structure design. Disney+ uses log-driven performance monitoring to adapt bitrates, proving that automated data pipelines outperform manual tweaking in flexible environments. Similarly, network operators must treat configuration data as a continuous stream requiring AI integration for future scaling. Manual methods cannot sustain the velocity required by modern edge networks where conditions change quicker than human reaction times. The limitation remains that automation amplifies bad data just as efficiently as it deploys good configurations.
Implementing Zero-Touch Deployment and RBAC for Enterprise Networks
Implementation: Defining Zero-Touch Deployment with NetBox and Paramiko
Operators must implement these steps to eliminate manual errors:
- Populate NetBox with device serial numbers and intended configuration roles.
- Execute Python glue code to render Jinja templates against the inventory database.
- Deploy Paramiko to initiate SSH connections using the verified serial identity.
- Trigger Zabbix polling to transition device status from planned to active. The limitation lies in the strict dependency on data integrity; a single incorrect serial entry in NetBox causes the automation to target the wrong hardware. Unlike historical methods documented in RFC 789, this model prevents configuration drift but introduces a new failure mode where the source of truth itself becomes the single point of failure.
Render router-ready configs by extracting NetBox JSON, applying Jinja logic, and triggering email approvals before push.
- Python scripts query the source of truth to fetch device serial numbers and interface assignments.
- The engine processes raw inventory data through Jinja templates to generate valid syntax for target hardware.
- Operators receive automated email requests to validate the rendered output against expected network states.
- Approved changes trigger Paramiko sessions that push configurations directly to the live control plane.
This workflow supports the multi-provider DNS architectures increasingly common in modern enterprise edge designs. The separation of data rendering from execution prevents accidental syntax errors from reaching production routers during high-volume updates. A single template error could otherwise propagate across hundreds of radio nodes simultaneously. The cost of this rigidity is delay; manual approval gates slow down emergency repairs compared to fully autonomous systems. Mobicom adopted this hybrid model to balance speed with safety, reducing wage costs tied to on-site visits while maintaining strict control over backhaul updates. InterLIR recommends testing these pipelines in staging environments that mirror production topology exactly before enabling live pushes.
Implementation: NetBox Automation Versus Manual RFC 789 Era Console Inputs
- Extract device serial numbers from the NetBox source of truth using Python glue code.
- Render hardware-specific syntax by passing raw inventory through Jinja templates.
- Trigger email-based approval workflows to validate changes before execution.
- Deploy approved configurations over Secure Shell using Paramiko libraries. The shift removes the latency of physical site visits, enabling remote updates for mobile backhaul systems under fluctuating loads. However, reliance on automated push mechanisms introduces a single point of failure if the source of truth contains corrupted entries. Network teams must implement strict read-only replicas to prevent bad data from propagating across the entire fleet during a bulk update. This architectural tension defines the boundary between efficient scale and catastrophic misconfiguration.
About
Vladislava Shadrina serves as a Customer Account Manager at InterLIR, where she specializes in client relations within the critical domain of IP resources. While her background includes architecture, her daily work managing IPv4 address rentals and leasing directly intersects with the complexities of modern network management. This role provides her with unique, frontline insights into how enterprises secure the fundamental infrastructure necessary for reliable DNS logs and configuration stability. At InterLIR, a Berlin-based marketplace dedicated to transparent and secure IP redistribution, Shadrina helps organizations overcome resource shortages that often hinder network optimization. Her experience guiding clients through efficient, automated processes ensures they possess the clean, reliable IP assets required for accurate DNS-based analysis. By connecting resource availability with operational needs, she highlights why solving IP scarcity is necessary for the scalable, data-driven networks discussed at APRICOT 2026.
Conclusion
Scaling automated DNS log aggregation exposes a critical fragility: latency spikes during bulk updates can desynchronize edge nodes before validation logic intervenes. As CDNs pivot toward distributed edge computing platforms by 2027, the operational cost shifts from manual entry errors to data propagation delays that corrupt real-time traffic analysis. Relying solely on centralized source-of-truth repositories creates a bottleneck where a single corrupted JSON payload disables thousands of edge instances simultaneously. Teams must decouple validation from deployment to survive this transition.
Adopt a split-architecture strategy by Q4 2027 for any infrastructure exceeding 500 nodes. Mandate that all configuration renders occur in isolated, read-only sandbox environments before crossing the production boundary. Do not attempt full fleet updates without first verifying template integrity against a synthetic traffic mirror. This approach contains failures locally rather than allowing them to cascade globally.
Start by auditing your current JSON payload size against your API rate limits this week. Calculate the maximum theoretical throughput of your existing validation pipeline and compare it to your peak traffic ingestion rates. If your rendering engine cannot process changes quicker than your log volume grows, your automation framework will become the primary cause of outages rather than the solution. Fix this throughput mismatch before adding new edge locations.
Frequently Asked Questions
Public resolvers handle most lookups, hiding traffic paths from operators. In Bangladesh, 60% to 70% of DNS queries are resolved by third parties like Google, surrendering content location decisions.
Modernization plans aim for widespread implementation of automated network management tools. The 2026 Enterprise Modernization Plan specifically targets greater than 75% adoption of such automated systems to replace manual tracking.
PowerDNS Recursor uses scripting to identify specific queries safely. Engineers use its Python or Lua mechanisms to capture interactions with parent domains and feed JSON data into ClickHouse tables.
The architecture relies on three fundamental tables for effective data reduction. These tables store raw queries, the selected CDN-IP map, and a data reduction over these primitives for dashboards.
Enterprise customers require strict access controls to prevent data leakage. Akvorado lacks Role-Based Access Control features, making it unsuitable for direct customer use compared to custom Grafana solutions.