Internet disruptions surged 92% as state actors weaponize
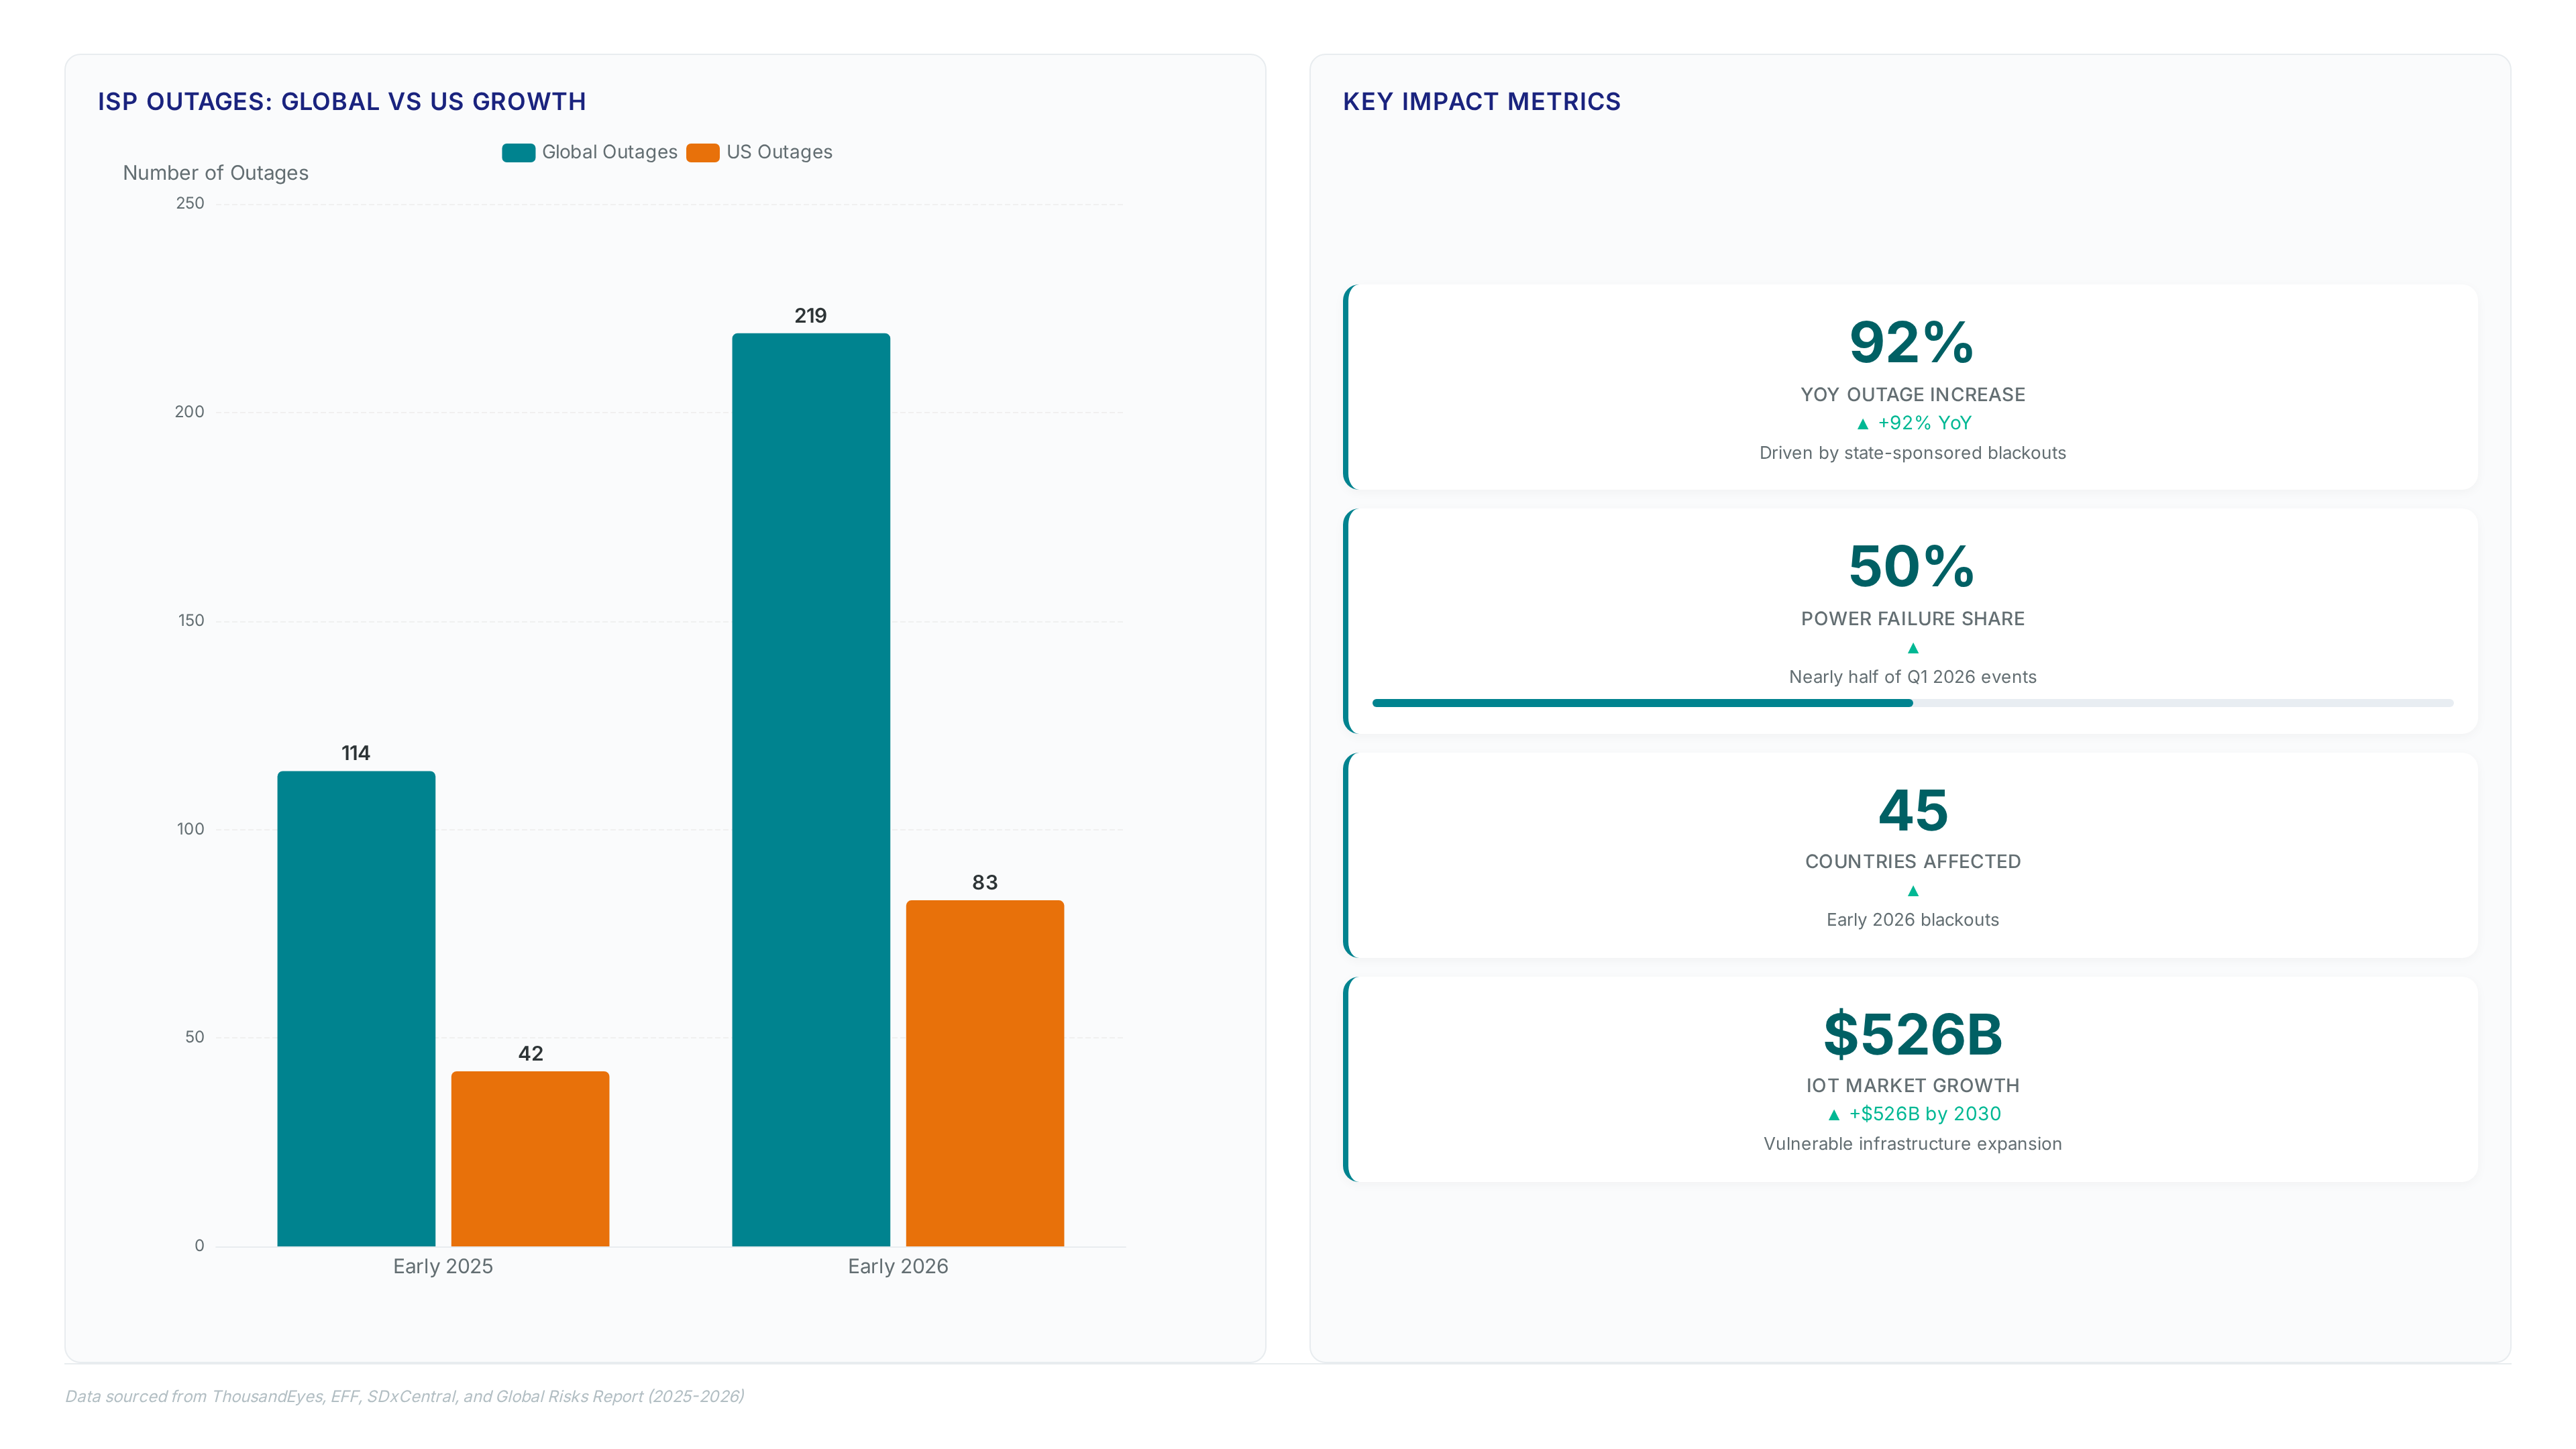
Global ISP outages surged 92% year-over-year to 219 incidents, marking Q1 2026 as the peak of weaponized internet disruptions. This escalation proves that connectivity loss is no longer an accidental byproduct of conflict but a deliberate instrument of political control and military strategy. The era of passive infrastructure vulnerability has ended; state actors now treat bandwidth as a tactical variable to be severed on command.
Readers will dissect the anatomy of these attacks, ranging from the government-directed shutdowns in Uganda and Iran to the physical destruction of grid infrastructure in Cuba. We will analyze how power failures accounted for 42.3% of verified events, surpassing technical glitches as the primary disruption vector according to Q1 2026 data. The narrative shifts from simple censorship to complex infrastructure failure mechanisms where drone strikes and grid collapses serve as force multipliers for digital isolation.
Finally, the discussion moves to operational strategies for detecting these regional blackouts before they become total silences. By examining the 83 incidents recorded in the United States alone, up from 42 the previous year, we establish a baseline for identifying anomalous traffic patterns indicative of coordinated attacks. Understanding these vectors is critical for distinguishing between natural degradation and the calculated regional connectivity loss defining this volatile geopolitical environment.
The Anatomy of Weaponized Internet Disruptions in Q1 2026
Defining Government-Directed Shutdowns and Aggressive Filtering
Regulators mandate government-directed shutdowns to sever connectivity, separating these acts from technical glitches or collateral war damage. Q1 2026 recorded 26 verified internet disruptions across 15 countries, signaling a tactical pivot toward state-controlled isolation. Operators distinguish full blackouts from aggressive filtering by watching border gateway protocol session states against raw traffic volume. Domestic traffic at the exchange point collapsed from 72 Gb to 1 Gb following a Uganda Communications Commission directive. This binary drop points to physical circuit termination or wholesale BGP withdrawal instead of selective packet inspection.
Contrasting Q1 2026 Escalation with 2025 Disruption Baselines
Global ISP outages surged 92% year-over-year, marking a definitive shift toward weaponized outages as statecraft. Q4 2027 lacked government-mandated blackouts, whereas early 2026 featured prolonged severance in Uganda and Iran tied to electoral cycles. This escalation transforms connectivity losses from incidental failures into calculated political control The United States saw incidents nearly double, rising from 42 to 83, indicating that even stable markets face collateral damage from global instability. Current disruptions follow specific military strategy timelines unlike the random technical faults of 2025. Lost productivity and potential data exfiltration Operators cannot rely on standard BGP convergence when peers actively withdraw routes under duress. Detection requires analyzing traffic drops against known election calendars rather than simple threshold alerts.
Infrastructure Failure Mechanisms from Drone Strikes to Grid Collapses
Mechanics: Mechanics of Weaponized Outages via Energy Grid Attacks
Direct strikes on substations trigger immediate router power loss, collapsing BGP sessions before backup generators engage. Connectivity issues in Portugal saw traffic drop 70% in Leiria as ERedes customers lost electricity, proving physical kinetic action severs digital paths quicker than filtering policies. This cascade begins when uninterruptible power supply units exhaust capacity, forcing border routers to withdraw AS path advertisements silently. The failure mode differs from software bugs; no reset command restores connectivity while the grid remains dark. Operators observing Storm Kristin landfall
| Failure Stage | Physical Trigger | Network Symptom |
|---|---|---|
| Initial Impact | Substation destruction | Next hop unreachable |
| Secondary Effect | Generator fuel depletion | Local preference reset |
| Terminal State | Complete site blackout | Full prefix withdrawal |
However, reliance on diesel backups introduces a single point of failure; attackers now target fuel depots to extend outage duration beyond battery limits. The cost of this tactic is measurable: AWS facilities in the Middle East suffered structural damage from drone strikes, disrupting power delivery and forcing fire suppression systems that caused additional water damage to servers. Recovery requires physical repair crews to access dangerous zones, delaying route re-origination for days rather than minutes.
Complete loss of announced IPv4 space defines the Flow Grenada outage signature, distinguishing total withdrawal from filtering. Operators identify this mechanism by monitoring border gateway protocol updates for vanishing prefixes rather than simple traffic dips. Unlike aggressive filtering which maintains AS path advertisements, physical destruction or cable cuts force routers to silently withdraw routes. This specific failure mode appeared in the Republic of Congo, where traffic fell 82% below expected levels following WACS submarine cable damage. Detection requires correlating volume drops with routing table changes to confirm infrastructure collapse.
| Indicator | Filtering Event | Infrastructure Failure |
|---|---|---|
| IPv4 Announcements | Stable | Withdrawn |
| Traffic Pattern | Gradual decline | Immediate cliff |
| Recovery Signal | Policy change | Physical repair |
Differentiating unknown cause internet outages demands analyzing announced IP address space alongside volume metrics. A drop in announced space confirms networks cease telling the world how to reach those addresses. Cloud infrastructure failures often mimic this pattern when data centers lose power entirely. Fixing connection failure in cloud infrastructure starts with verifying if the provider still advertises the next hop reachable via standard paths. Hybrid monitoring tools comparing protocol-level anomalies against macro traffic drops provide necessary context. Silent withdrawals offer no error messages, leaving operators blind without external visibility.
Fragility of Undersea Cables and Single Points of Failure
Physical damage to the West Africa Cable System silenced Republic of Congo connectivity for roughly two days, exposing single points of failure in national backbones. This incident illustrates how one cut disables entire countries when redundant paths do not exist. The mechanism differs from power loss; routers stay online but lose upstream reachability because the physical layer severs the only exit. Such fragility mirrors concentration risks in cloud traffic, where top US regions now carry 67.74% of all requests, creating similar bottlenecks. Operators often mistake these events for unknown cause internet outages because routing tables withdraw silently without alarm thresholds triggering.
| Failure Mode | Detection Signal | Recovery Time |
|---|---|---|
| Cable Cut | Prefix withdrawal | Weeks |
| Grid Collapse | Session timeout | Hours |
| Drone Strike | Hardware destruction | Days |
The limitation is geographic; no software patch fixes a severed fiber optic strand on the ocean floor. Studies by Munich Re warn that such physical vulnerabilities could cascade into catastrophic global infrastructure failures.
Bytes-Based Versus Request-Based Metrics for Outage Detection
Bytes volume graphs reveal total blackouts, whereas request counts expose selective filtering patterns during active disruptions. Bytes-based metrics track aggregate payload throughput, making them ideal for identifying physical severance or complete government mandates. Cloudflare data showed a near-complete loss of traffic from Uganda starting with the shutdown, remaining effectively at zero through 23:00 local time on January 17. (Cloudflare's technology behind radar2) This flatline signature confirms infrastructure collapse rather than throttling. Conversely, request-based graphs monitor transaction frequency, detecting scenarios where networks remain online but specific services are blocked. Protocol-level anomalies often manifest as sustained request counts with zero successful handshakes, indicating aggressive filtering rather than cable cuts.
| Metric Type | Detects Best | Failure Signature |
|---|---|---|
| Bytes Volume | Total Blackouts | Traffic drops to zero |
| Request Count | Throttling/Filtering | High attempts, low success |
Operators relying solely on packet loss miss detailed censorship events where DNS query anomalies persist despite blocked content delivery. The limitation of bytes monitoring is its blindness to partial outages; a significant reduction in specific application traffic may not shift total volume enough to trigger alerts. Request granularity exposes these targeted restrictions. Production networks require both streams to distinguish between a router power failure and a firewall policy change. Blind spots in one dataset become visible in the other, enabling precise incident classification.
Tracking Election-Related Shutdowns Using Cloudflare Radar and OONI
The Uganda Communications Commission ordered mobile operators to suspend public Internet access effective 18:00 local time on January 13. Operators correlate traffic drops with protocol blocks to distinguish government mandates from infrastructure collapse. Domestic flow at the Uganda Internet Exchange Point fell from approximately 72 Gbps to 1 Gbps immediately following the directive. Cloudflare Radar aggregates volume data to identify these macro-level drops indicative of shutdowns. OONI focuses on protocol-level anomalies like QUIC blocking to detect censorship techniques often missed by volume graphs.
| Metric Type | Detects | Blind Spot |
|---|---|---|
| Bytes Volume | Total blackouts | Selective filtering |
| Request Count | Service blocking | Background noise |
| DNS Queries | Resolution failure | Encrypted tunnels |
Meanwhile, the UCC defended the action as necessary to curb misinformation and electoral fraud risks. Connectivity remained effectively at zero through 23:00 local time on January 17. Partial restoration occurred only after the incumbent president was declared winner. Staggered implementation across operators frequently obscures the exact start time without multi-source correlation. Relying solely on bytes-based graphs misses detailed filtering where specific applications remain reachable. False negatives occur when traffic shifts to unmonitored ports during partial blocks. ### Validation Checklist for Reporting Government-Directed Disruptions
Analysts must cross-reference regulator statements against traffic baselines before classifying an event as a government-directed shutdown. Distinguishing intentional blackouts from infrastructure collapse requires verifying that AS path advertisements remain stable while volume drops to near-zero. Reports citing weaponized outages must link specific political directives to the exact hour of connectivity loss, as seen in Uganda where traffic flatlined following a UCC order. Differentiating filtering from physical damage demands checking for route withdrawals; aggressive filtering maintains prefix announcements while silencing payloads. ThousandEyes defines network outages as events with 100% packet loss within an Autonomous System, a threshold often unmet during selective censorship. Conversely, OONI Observatory identifies protocol-level anomalies like QUIC blocking that volume graphs miss. A valid report confirms duration data matches the regulatory window, excluding power failures which accounted for nearly half of Q1 disruptions. Operators should reject claims lacking evidence of command-and-control indicators, such as explicit suspension orders from national commissions. Final publication requires correlating the drop with known political control events rather than assuming causality from traffic dips alone. This rigor prevents mislabeling accidental failures as state actions.
Strategic Lessons from the Rise of State-Sponsored and Environmental Outages
Weaponized Outages as Political Control Tools
Ugandan authorities commanded a suspension of public Internet access at 18:00 local time on January 13, establishing a set government internet blackout. Domestic flow at the Uganda Internet Exchange Point collapsed from approximately 72 Gb to 1 Gb, confirming total severance rather than throttling. This specific election internet shutdown shows regulators weaponizing connectivity to suppress political opposition during voting cycles. Operators distinguish these events from accidental failures by analyzing the simultaneity of the drop across all mobile network operators.
Traditional network durability strategies fail because they focus on logical redundancy rather than geographic dispersion. Operators assuming cloud provider diversity guarantees uptime face single points of failure when kinetic weapons strike a specific metro area. Physical cable damage disrupted the Republic of Congo's internet for around two days, illustrating the fragility of undersea infrastructure as noted in reports on cable damage. Cyber insecurity has emerged as a top global risk, reflecting the increasing frequency of cyberattacks and the vulnerability of critical infrastructure to physical and cyber-physical threats per the Global Risks Report.
Cuba's three national grid collapses illustrated how infrastructure fragility now dictates digital continuity more than protocol errors. Power failures accounted for nearly half of all events in Q1 2026, shifting the primary threat vector from software bugs to kinetic energy loss. Operators analyzing disruption events must now prioritize physical durability over redundant peering, as centralized grids create single points of failure that bypass BGP safeguards entirely. Physical blackouts silence telemetry instantly unlike government directives which allow for AS path monitoring, leaving operators blind to the root cause until power returns. This asymmetry demands a strategic pivot where network durability planning includes independent micro-grids rather than relying solely on municipal infrastructure. The constraint remains economic; few ISPs can afford dual-fed substations, forcing a choice between coverage density and survivability. Future architectures must treat electricity as a routing protocol attribute, weighting paths by local grid stability scores. InterLIR recommends mapping power outage histories against PoP locations to identify high-risk nodes before the next seasonal storm cycle.
About
Evgeny Sevastyanov serves as the Head of Customer Support at InterLIR, a Berlin-based IPv4 marketplace dedicated to solving global network availability challenges. His daily work managing critical IP resources and maintaining clean BGP route objects positions him uniquely to analyze the sharp rise in internet disruptions detailed in this report. As governments in Uganda and Iran enforce blackouts and power outages cripple infrastructure, Sevastyanov's team directly assists organizations in mitigating connectivity loss through reliable IP redistribution. Sevastyanov uses his hands-on experience with RIPE and APNIC databases to ensure clients maintain operational durability despite these volatile global trends. His insights bridge the gap between raw disruption data and the practical necessity of securing critical network resources in an increasingly unstable digital environment.
Conclusion
The surge in global ISP outages reveals that physical severance now outweighs logical misconfiguration as the dominant disruptor. When undersea cables fracture or municipal grids fail, redundancy protocols become irrelevant because the energy layer collapses before data can reroute. This shift imposes a hidden operational tax: maintaining connectivity now requires funding kinetic hardening rather than just software updates. Organizations relying on centralized power for their edge nodes face inevitable downtime as climate volatility and geopolitical friction increase the frequency of physical cuts. The math is simple; a 1 Gb residual capacity cannot support modern payloads, rendering high-bandwidth SLAs void during regional blackouts.
Executives must mandate energy-independent architecture for all critical Points of Presence by Q4 2027. Do not wait for regulatory mandates; treat local grid stability as a primary routing metric equal to latency. If your current disaster recovery plan lacks off-grid generation specs, it is already obsolete. Start this week by auditing the power source history of your top five traffic hubs against local utility failure logs. Identify any node lacking 72 hours of autonomous fuel capacity and draft a retrofit budget immediately. This specific inventory creates the baseline for survivability scoring, allowing you to allocate capital where physical fragility poses the greatest revenue risk.
Frequently Asked Questions
Power outages emerged as the primary root cause for most verified disruptions globally. Data confirms that energy grid failures accounted for 42.3% of all verified events during the first quarter.
Domestic traffic at the exchange point collapsed from 72 Gb to just 1 Gb following the directive. This binary drop indicates physical circuit termination rather than selective packet inspection methods.
Russian missile strikes on Ukrainian infrastructure triggered immediate connectivity loss in Dnipropetrovsk. Traffic in the region plunged nearly 50% below baseline levels as routers lost power simultaneously.
Asiatech was the largest contributor to the loss, dropping 4.46 million /48-equivalents of address space. This single provider accounted for 9.4% of Iran's entire IPv6 space loss during the event.
Global ISP outages surged 92% year-over-year, marking a definitive shift toward weaponized disruptions. This escalation proves connectivity loss is now a deliberate instrument of political control and strategy.